With the abundance of data available, it can be easy to overwhelm your audience. Therefore it’s crucial to use visualization techniques that not only capture […]
Tag: data visualization
Two cool charts for dashboards
Dashboards play a crucial role in providing concise, real-time insights, enabling stakeholders to make informed decisions. Traffic light charts and gauge charts are valuable tools […]
5 Unique Bar chart variants
Bar Chart is a very popular way of visualizing qualitative data. It displays data using rectangular bars where the length of each bar is proportional […]
Infographic chart in excel
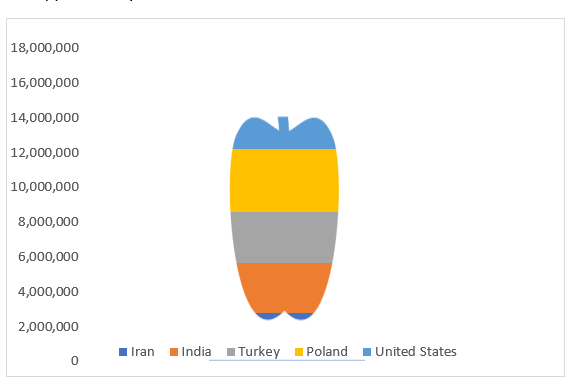
Infographics is visual representations that use a combination of graphics, images, text, and colour to present complex information in a clear, concise, and memorable way. […]
Traffic Light in Excel: Visualizing Performance and Progress
A traffic light chart is a visual representation used to quickly convey the status or performance of a set of key performance indicators (KPIs), projects, […]
Sample Visualization using Tableau
This is an example of Basic Tableau analysis completed for Data, Analytics, and Learning course in EDX. Tableau is an easy-to-use analytics and data visualization […]


