Have you ever found yourself tangled in the intricate web of a large multidimensional dataset?
Engaging with extensive multidimensional datasets can be a formidable challenge, especially when undertaking Exploratory Data Analysis (EDA). The complexities intensify as the dimensions multiply, making visualization a Herculean task.
In this blog, we’re breaking down EDA into simpler terms and introducing you to three game-changing techniques.
Exploratory Data Analysis (EDA) is the cornerstone of any data science initiative, involving exploring variable relationships through graphical tools. However, the challenges escalate as the dataset burgeons into a high-dimensional space.
We present to you three techniques which you can use for EDA.
- Clustering
- Heatmap
- Dimensionality reduction
1. Clustering: Simplifying with Summaries
Ever heard of clustering?


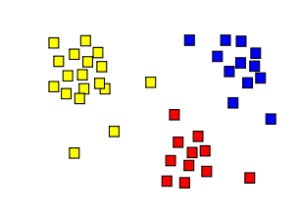
It’s like organizing a chaotic room by grouping similar items. In the realm of EDA, clustering helps by replacing a multitude of data points with a handful of cluster centroids or representatives.
These clusters act as snapshots, offering a high-level view of different groups within the dataset. By segregating data into these homogenous groups, clustering emerges as a superhero, simplifying the daunting task of EDA.
2. Heatmap: Painting Patterns with Colors
Imagine if your dataset were a masterpiece, and a heatmap is your palette of colors.

Heatmaps provide a visual representation where values in a matrix transform into a vibrant spectrum. Each cell in the matrix dons a color, ranging from cool to warm hues. Cool colors represent lower values, while warm ones denote higher values. Heatmaps are like magical lenses, uncovering patterns, trends, and variations in large datasets, making EDA a more colorful and insightful journey.
3. Dimensionality Reduction: The Art of Simplifying
Two key techniques for reducing the data size that goes beyond the summaries generated by clustering are PCA and SVD.
PCA – Unveiling the Hidden Dimensions
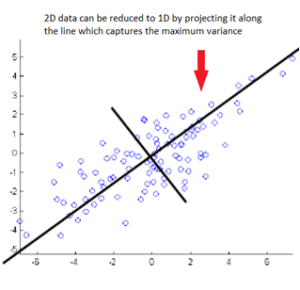
PCA is a dimensionality reduction technique that transforms correlated variables by projecting them into new coordinates, capturing maximum variance. In technical terms, it simplifies the intricate interdependencies among variables, streamlining the EDA process.

Dimensionality reduction is achieved by retaining a subset of these principal components or the transformed variables.
SVD – The Marvel of Compression
SVD, on the other hand, is like a master sculptor chiseling away excess details. It breaks down complex data into more digestible components, aiming to create a smaller representation without compromising essential information.


We have two images here, a high-resolution image on the left and its compressed, equally expressive version on the right. That’s the magic of SVD: simplifying without losing the essence.
These techniques serve as indispensable tools, assisting in unravelling patterns, simplifying complexity, and encapsulating the essence of the data landscape.
So, gear up and let EDA be an adventure, not a challenge!


