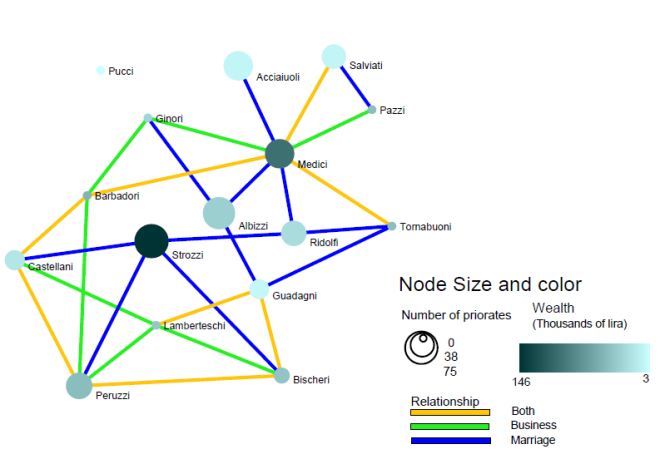
This is a visualization of the following attributes of Padgett’s Florentine families. The visual analysis was done using Sci2 tool.
- Wealth
- number of seats on the civic council between 1282-1344
- familty relationships between each other.
The dataset includes 16 different Italian families from the early 15th century. These families were locked in a struggle for political control of the city of Florence around 1430.
The below network diagram shows family as node and family relationships as edges. Size of node represents the number of seats in council while node color represents the wealth of the family. Three types of relationships between each other:(business relationship, marriage relationship, both types of relationships) are shown with unique color edges.
Strozzi family has the highest number of seats and is also the wealthiest of the lot. Larger and darker nodes have morerelationships with other families. The poorest of the lot is Pucci family and it stand isolated with no relationship with any other and no seats in council. Clearly, money and power seems to be dominating when it comes to relationships. More people want to have ties with rich and mighty.


