In continuation to my previous blog, here is the analysis of a blog and twitter sample network.
Blog
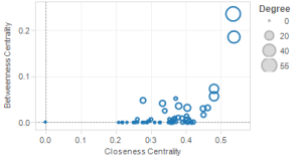
 Degree: Degree distribution is right skewed. Median Degree is 1, Maximum degree is 55. It is a highly centralized network which makes it very fragile. Only one node has degree of 55. Nodes are very loosely connected and nebulous which implies low sense of community and lack of homogeneity.


Closeness: Though closeness centrality ranges from 0.2 to 0.66, median is 3.4 and upper quartile is 3.57. Most of the nodes are not very close to each other confirming that the network is loose.
Betweeness: It has highly right skewed distribution. There are a large number of nodes which have 0 betweeness. While only one node has a max of 0.22 betweeness centrality. The scatterplot shows that there are few active nodes which form the center of cluster and show high betweeness as well as closeness.
Summary: The network is not homogenous and there is no sense of community. It is highly centralized, dominated by a few nodes making it highly fragile. Most of the nodes are attracted towards a node and since they do not have a similar postion it is scores poor on social capital generation. As the nodes lack homogeneity, the network would be a source of divergent ideas. There are few nodes which are very active in terms of collaborating with others and accessing new ideas.
Modules:
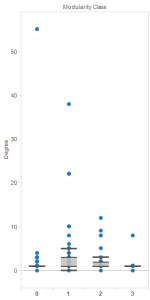
The network has been analyzed for four communities as shown below in the picture.


Community 1 has more members with better connectivity in contrast to Community 0 which only has a single member(may be the blogger) who has the maximum connection. The other two communities are relatively smaller.
Though the blogger appears to be a part of Community, the other members in that community are not well connected among themselves. Blogger shows higher closeness and betweenness and links to another community 1. Community 1 shows relatively higher betweenness showing that the members have better access to new ideas and scores higher on creativity. Community 2 and 3 are very small don’t seem to be very significant. Community 1 seems to be a prominent sub community in itself.

Degrees : Maximum degree is 99 while the median degree is 2. The graph is highly right skewed. The connections are very few and loose. There are a lot of peripheral players. It is dominated by 4-5 players who can said to be forming core of their sub communities. There are more players in the periphery than in the core. Since the median degree is 2, the network is very fragile. Removal of the few core components can render the network broken.


Betweeness: Between centrality is negligible for almost all of the nodes. Only a few nodes have relatively higher betweeness.
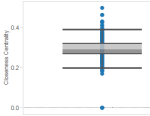
Closeness: Five num summary for closeness centrality is: 0.19, 0.27, 0.27, 0.32, 0.39. The maximum is 0.49.
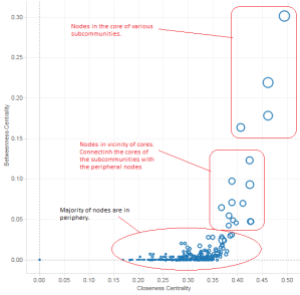
The scatterplot between betweenness and closeness centrality is shown below:

Summary: We can say that the network consists of a community whose core shows the maximum degrees, betweenneess and closeness centrality. This core node in turn connects with the various smaller sub communities. Network would be fragile. Nodes forming the core of subcommunities would score good on creativity and leadership. The intermediate nodes which are clustered around various core would be more homogenous and would score good on achievement and performance. They have access to fresh ideas from the weak ties with the peripheral nodes as well as information and influence from the core nodes which could said to be leaders in their own field.
Communities
The network has been analyzed for 7 sub communities.

One of the communities labeled here as Community 1 is the largest. It can be said to be the core of the network around which various sub communities have emanated. The core of this network would be comprised of very knowledgeable and important nodes ranking high on influence and leadership. Several other nodes that are important in their own field seem to have connected to this code. These nodes form the core of their own communities which in turn are followed by the nodes which are more homogenous.
We can say that various sub communities specialize in different field and the entire network thus is good source of knowledge put together from divergent areas. It would score good in the field of innovation but low on sense of community. It is fragile with not so good information flow with a risk of information bottleneck.

