
Given below is analysis of four simple networks. This analysis is an attempt to peek into the networks and make sense of their structure, the relationships among the actors so on and so forth.
Network 1
Degree Centrality Distribution:


Degree centrality distribution show that there are couple of nodes which are not well connected to others but other nodes are well connected to each other and are as the same level. This implies that there is strong sense of community in the network. Information dissemination would be quite fast and owing to same level of connectivity of most of the nodes the network would do good in terms of social capital generation as most nodes would contribute to it.
Betweeness Centrality:


Betweenness centrality distribution shows that very few (in fact only one ) node has high betweenness centrality. This shows that the network has only limited access or connectivity to other networks which means that scope of creativity and fresh ideas is limited. Also the network is at a potential risk of knowledge bottleneck.
Closeness Centrality Distribution:


Most nodes are similarly positioned in terms of closeness centrality. The implies that the network nodes have access to opportunities and have a potential to perform good.
Summary: Overall, the network is well integrated with a high sense of community. Information flow would be quick. There is a potential of good social capital generation. However, access to new ideas from outside is limited. So it does not score high in terms of innovation. It would be high on achievement and performance in general but low on innovation.
Network 2


Degree: One node has a very high degree and is well connected to others. Majority of nodes have degrees as 3. The network seems to be well connected overall. Node that has a high degree does not have a high betweeness showing that node is acting as a hub. Since the median centrality is 3, removal of this central node will not damage the network as other nodes are well integrated with each other. Network is not fragile and information flow in this network would be fast and most of the nodes would be contributing towards social capital as they are similarly placed in the network.

 Betweeness: Median betweenness centrality is 0.83 which is very low showing that most of the nodes are a part of a cluster. These chunk of nodes form the core of network and do not have much access to outer space. However there are couple of nodes which show high betweeness centrality thus linking other communities. So we can say that in this network there is adequate flow of fresh ideas which is good for innovation.
Closeness Centrality: Barring a few outliers we see that among the other nodes which are well connected to each other the closeness centrality is not very skewed showing that most nodes are reasonably close to each other emphasizing that the network is well integrated. There are good numbers of leaders who occupy position of influence and are well positioned to access opportunities.
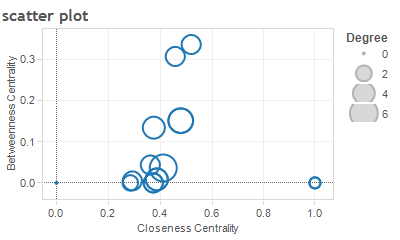
The scatter plot shows that the node with the high betweenness centrality is the one with the closest to most nodes. The one with the highest degree does not have high betweeness.
Summary: The network is not individual dominated which means that it is not fragile. It is well integrated as the degree distribution with close nodes is good which implies that it is good in terms of information exchange. Good distribution of high betweenness nodes means that there is good creative potential. Intercommunity links would give access to fresh ideas. It scores high on social capital as most nodes have a similar network position. It is not individual dominated. Enough number of leaders and influencers means that access to opportunities and performance levels would be high.
Communities
There are two prominent communities which are being analyzed. A dashboard showing the distribution of various centralities of the two communities is shown below:

The distribution shows that both the communities differ in terms of degrees and closeness while the betweenness distribution is similar. While one community (identified here as Community 0) appears to be more integrated with nodes having higher sense of community. Nodes are much closer to each other showing that it comprises of high performing individuals. This network is also better in terms of social capital generation. It is more homogenous and clustered. Community 1 on the other seems to comprise of individuals who do not necessarily form a community. The underlying reason behind their integration is not a sense of community but quest for information. They appear to be less homogenous. They are constantly on lookout for new ideas implying that they are more creative.

Excellent! The small chart work really work well with the text flowing around them.